Bitcoin History About To Repeat Itself. [mind blowing!!!]
Bitcoin has reprinted exactly the same pattern on the chart, like what we have seen at the beginning of the year, before the huge dump from current ATH at $64k to $29k before pumping back up.
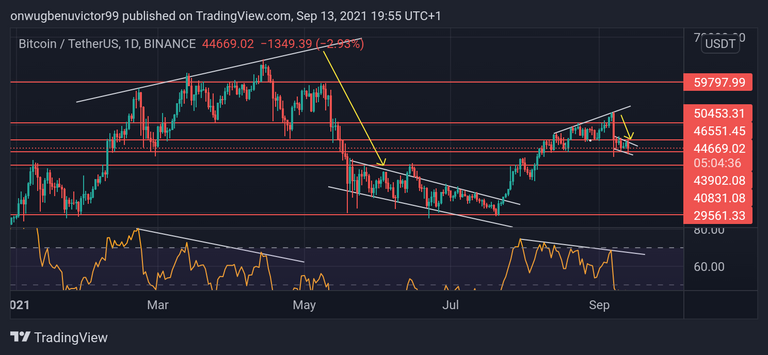
So now let go into the chart in detail, look at the chart above you will notice, that while price was making higher highs, from February till April, the RSI line was making lower lows, which is a bearish divergent.
After that price drop massive and form the descending channel, then it broke out of the descending channel in July.
Then Bitcoin began to sky rocket, until August ending, beginning of September where price repeated exactly what it has done before. It started making higher highs and the RSI line was making lower lows, and then price fell aggressively.
And now Bitcoin has formed a descending channel again, exactly as before, If it breaks out of this descending channel formed, like it did in July, then we should expect the bull trend to continue.
Posted Using LeoFinance Beta